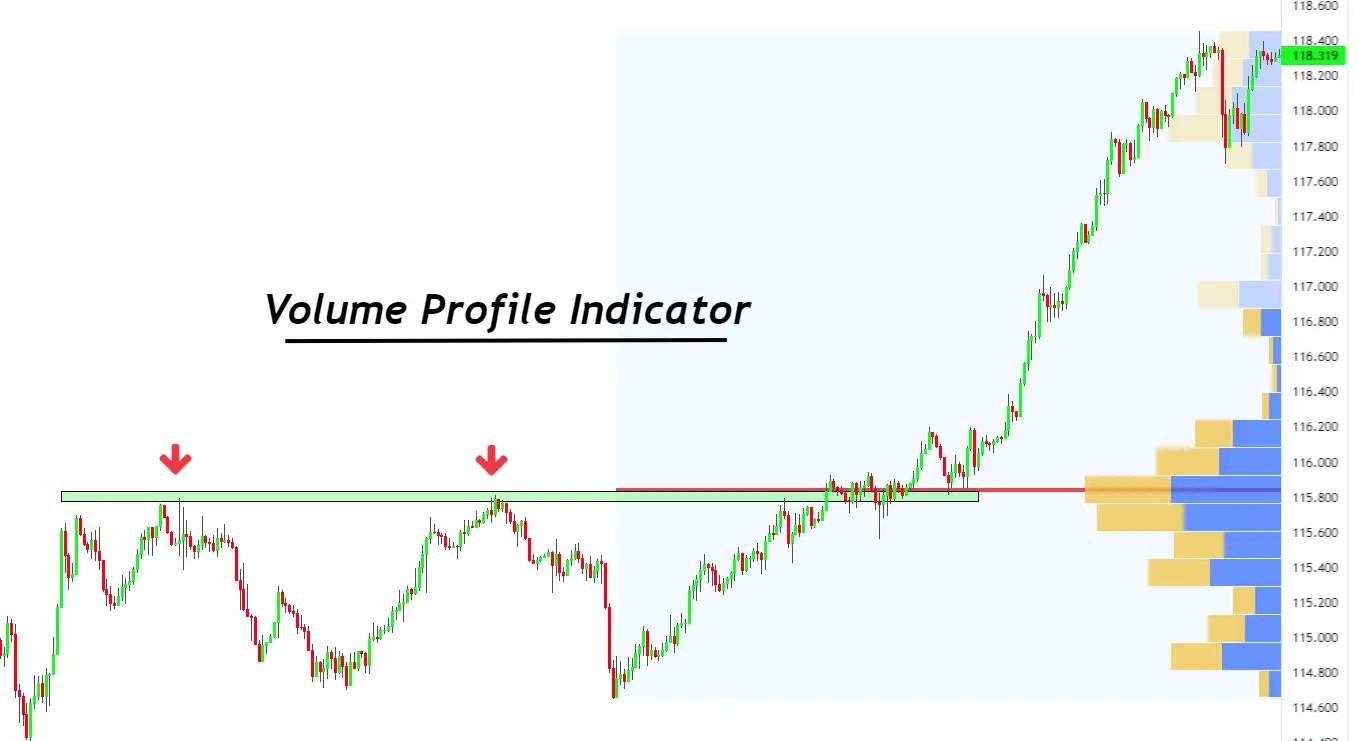
If you’re interested in mastering the art of indices trading, understanding and effectively utilising technical indicators is crucial. One such powerful tool in your trading arsenal is the Volume Profile Indicator. In this blog pṣost, we will delve into the world of Volume Profile Indicators, explore their types, and learn how to use them for successful trading. Additionally, we’ll introduce you to the perfect platform to kickstart your trading journey and learn through Indices Trading Academy.
What are Volume Profile Indicators?
Volume Profile is a technical indicator used by traders to analyse the volume traded at specific price levels over a given period. Unlike traditional volume indicators that show volume based on time, Volume Profile displays it based on price. By doing so, it provides valuable insights into price levels where significant trading activity has occurred, thus acting as a powerful guide for traders.
Types of Volume Profile Indicators
- Volume Profile Bars:
Volume Profile Bars are the most common type of Volume Profile indicator. It represents volume data as a histogram or vertical bars on the side of the price chart. Each bar’s height corresponds to the volume traded at a specific price level during a given period. Traders can easily identify areas of high trading activity (volume clusters) by observing the taller bars. These areas often act as important support and resistance levels, guiding traders in their decision-making.
- Volume Profile Bands:
Volume Profile Bands use bands or lines on the price chart to represent different volume levels. Instead of using bars, this indicator displays the volume as a continuous line or a series of lines on the chart. The bands help traders visualise the distribution of trading volume across different price levels. By analysing the width and positioning of the bands, traders can identify areas of high and low volume and determine potential support and resistance zones.
- Volume Profile Sessions:
Volume Profile Sessions provide a breakdown of trading volume during specific timeframes, such as daily, weekly, or monthly sessions. This indicator allows traders to analyse how volume varies within different trading sessions, helping them understand intraday or intraday trading patterns. By focusing on specific sessions, traders can spot trading opportunities and make more informed decisions based on the volume activity during those periods.
- Volume Profile POC (Point of Control) Lines:
The Point of Control (POC) is a specific price level on the Volume Profile where the highest volume of trades occurred during a given period. Some Volume Profile indicators highlight this point using a horizontal line on the price chart. Traders pay close attention to the POC as it often acts as a significant price magnet, attracting the market towards it. It can serve as a reference point for potential entries, exits, and stop loss levels.
How to Trade With a Volume Profile Indicator?
Now that we have a good grasp of Volume Profile Indicators and their types, let’s explore how to use them effectively for indices trading:
- Identifying Key Price Levels:
Look for areas on the Volume Profile where significant spikes in volume occur. These are called Point of Control (POC) and represent price levels where most trading activity took place. These POCs act as crucial support and resistance levels.
- Confirming Breakouts and Reversals:
When the price breaks above the POC, it indicates a potential upward trend, while breaking below signals a possible downward trend. Combined with other technical indicators, traders can identify reliable breakout and reversal points.
- Analysing Volume Gaps:
Volume gaps on the Volume Profile indicate areas where trading activity was low or nonexistent. These gaps may act as future support or resistance zones, providing valuable insights for trading strategies.
- Using Volume Profile with Other Indicators:
To enhance the accuracy of your trading decisions, consider combining the Volume Profile Indicator with other technical indicators like Moving Averages, RSI, or MACD.
Start Your Trading Journey by Learning With Indices Trading Academy
If you’re new to trading indices or looking to refine your skills, an Indices Trading Academy like Queensway Academy is the perfect platform to kickstart your journey. Here’s what makes it an ideal choice:
- Comprehensive Courses:
The academy offers comprehensive courses on trading indices, covering everything from the basics to advanced strategies. Whether you’re a beginner or an experienced trader, there’s something for everyone.
- Expert Traders as Instructors:
Learn from seasoned traders who have a proven track record in trading. Benefit from their experience, insights, and practical tips to improve your trading skills.
- Practical HandsOn Learning:
The academy emphasises practical learning with real-world examples and simulations. Gain confidence by applying your knowledge in a risk-free environment.
- Supportive Community:
Connect with like-minded traders through the academy’s community forums. Share ideas, seek advice, and grow together as traders.
Conclusion
In conclusion, mastering the art of trading indices requires a solid understanding of technical indicators like the Volume Profile Indicator. By analysing trading volumes at specific price levels, traders can gain valuable insights into market trends, breakouts, and potential reversals. Combine this powerful tool with other indicators, and you have a winning strategy.
If you’re ready to embark on your trading journey, the Trading Academy provides the perfect platform to learn and grow as a trader. So, why wait? Equip yourself with knowledge, join the academy, and take charge of your trading success today. Happy trading!
